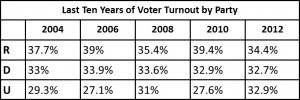
There has been much pushback by Democrats after today’s Quinnipiac poll showed that Republican Bob Beauprez is ahead 10 points against incumbent liberal Governor John Hickenlooper. We expect that tomorrow’s Quinnipiac poll will show Gardner ahead as well. With all the beating of breasts, tearing of hair and gnashing of teeth on the part of Democrats, we thought we should take a look at the past few election cycles’ turnout as that seems to be from where most of the complaining stems. Below is a chart of voter turnout by party over the past ten years. As you probably know, 2004, 2008, and 2012 were presidential election years.

We’re not pollsters, but here are a few patterns that we noticed:
- Democrats seem to come in at about 33% of the electorate regardless of whether it’s a presidential election year or a midterm election.
- Republicans make up a higher percentage of the electorate in midterm election years, which doesn’t necessarily mean they turn out more as a raw number. Remember, we’re talking percentage of the voters.
- The past two election cycles, unaffiliated voters have increased in percentage, but in midterm elections, it looks like unaffiliateds make up about 27 to 28% of the vote.
- In midterm election years, Republicans have composed about 39% of the vote.
Why does this matter? When Democrats try to disqualify polling when it doesn’t favor their candidates, they typically attack the sample composition. To be fair, it happens on both sides. Below are the samples by party of the five most recent polls in the Beauprez vs. Hickenlooper battle. From a casual observation, it would seem that most of the pollsters below are expecting a turnout more similar to a presidential election than a midterm election in Colorado. This means that Republicans make up less of the electorate and unaffiliateds make up more. It would be interesting to understand why they think turnout will be more like a presidential year, even when the wind of enthusiasm is at Republicans’ backs. So, pollsters, call us, maybe? Of course, the big wild card is how the mail-in ballots will impact turnout. There’s no way to know at this point who will mail a ballot back in. We’ll find out after November 4th, and keep you posted. In the meantime, this is just food for thought. BTW, H/T: Karen Crummy for the title.
Suffolk/USAToday
R: 33%
D: 31%
U: 35%
Beauprez: 40.8%
Hickenlooper: 43%
Marist/NBC
R: 32%
D: 32%
U: 35%
Beauprez: 39
Hickenlooper: 43
SurveyUSA/Denver Post
R: 33%
D: 33%
U: 33%
Beauprez: 43%
Hickenlooper: 45%
Quinnipiac
R: 34%
D: 27%
U: 33%
Beauprez: 50%
Hickenlooper: 40%
Project New America
R: 32%
D: 32%
U: 34%
Beauprez: 44%
Hickenlooper: 51%

It would be interesting to do the same for Primaries over the same cycles. That way you could compare primary turnout to general and have a possible prediction for general election turnout for 2014. I expect to see a higher turnout due to the all mail ballot process, which could make the electorate more like a POTUS cycle.
The Project New America poll is based on turning out the RAE voters. I am skeptical of their ability to turn out this electorate because I believe a lot more younger ladies have become immune to the #waronwomen meme and Hispanics have no real reason to be enthused for Hickenlooper or Udall.
The registration advantage for the GOP, along with the RNC support that has been in state, could definitely throw a wrench into the Dems ability to turnout the electorate they want/need to win.